
Using the Results Grid Filter
There are three types of filters available in the Results Grid. The first two options, Simple and Custom, work in the same way as filtering in Excel. The third option is known as Prefiltering.
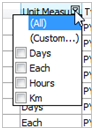
- Simple Filtering. Click on the filter Icon in the relevant field, either in the column headings or in the grouping section. This displays a list of options for that field - the default is to display all the options in the column.
From the list of options given, tick the boxes of those items you want to display in the grid. For example, in Payment Pay Items you may want to display items with a Unit Measure of Hours only: - Custom Filtering. Sometimes you may want to filter based on one or more ranges of information. Instead of clicking each individual entry within the range (as with the Simple Filter), the Custom Filter allows you to specify up to two conditions for filtering.
Click the filter icon and choose the Custom option to display the Custom Filter window. The following examples illustrate the use of Custom Filtering within All Pay Items:
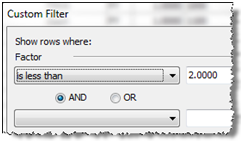
 - Display All Pay Items with a Factor that is less than a specified number:
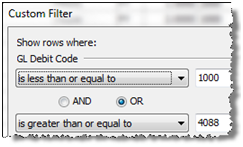
- Display All Pay Items with a GL Debit Code less than or equal to a specified value, OR greater than or equal to a higher value:
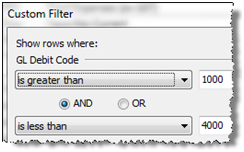
- Display only those Pay Item with a GL Debit Code between two specified numbers:
Note the use of ‘AND’ versus ‘OR’:
- ‘AND’ means that the employee needs to meet both of the criteria in order to be displayed.
- ‘OR’ means that the employee must fit one of the criteria in order to be displayed.
- In the second example, AND would not work because a GL Debit Code cannot be less than 1000 AND greater than 4088. In the same way, a Pay Item could not have a Unit Measure that is Each AND Hours at the same time.
Once a filter of any kind has been applied to a grid, the bottom of the grid will display the filter criteria that are currently applied, and the columns which are filtered will display a blue ‘filter’ icon.
Below the data results you will notice there is a filter toolbar which displays the criteria for the filter, as well as a Customize button, for example:

You may display this bar without previously applying a custom filter: click the Options button on the Data Explorer Toolbar, then select Filter Toolbar from the drop-down menu.
- Ensure the Filter Toolbar is displayed (either by applying a Custom filter, or by selecting Filter Toolbar via the Options button), then click Customize on this toolbar.
- The Filter builder window is displayed - this window allows you to build a complex custom filter to be applied to the data. Note that if you have previously applied a custom filter and you then click Customize, this Filter Builder window will display the contents of that filter.
- For a step by step guide to using the builder, see Understanding filtering with Prefilter.